
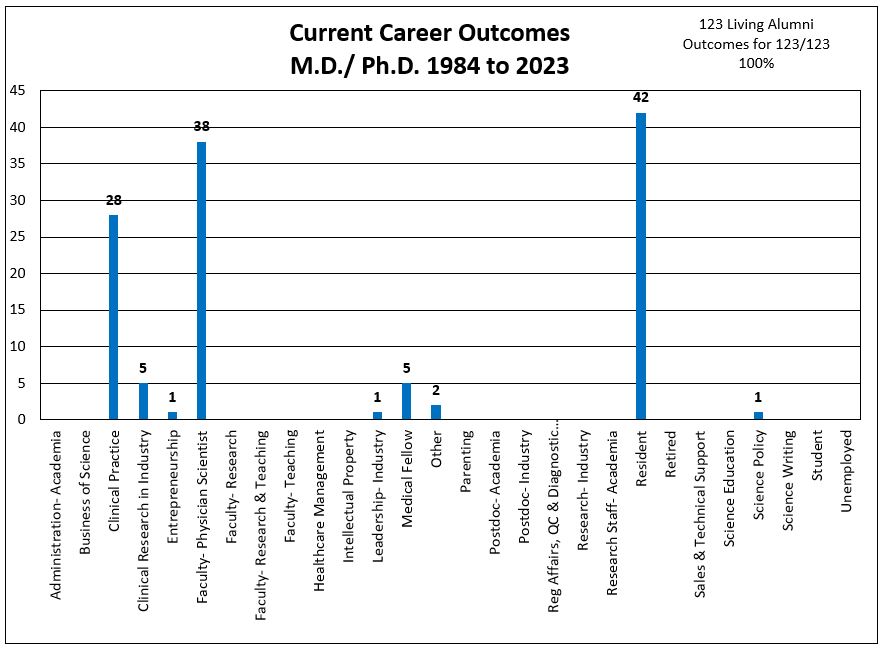
Current Career Outcomes for MD/PhD Graduates
Last updated October 2023
Current Career Outcomes broken out by years
Scroll down to see outcomes broken out into shorter ranges of years.
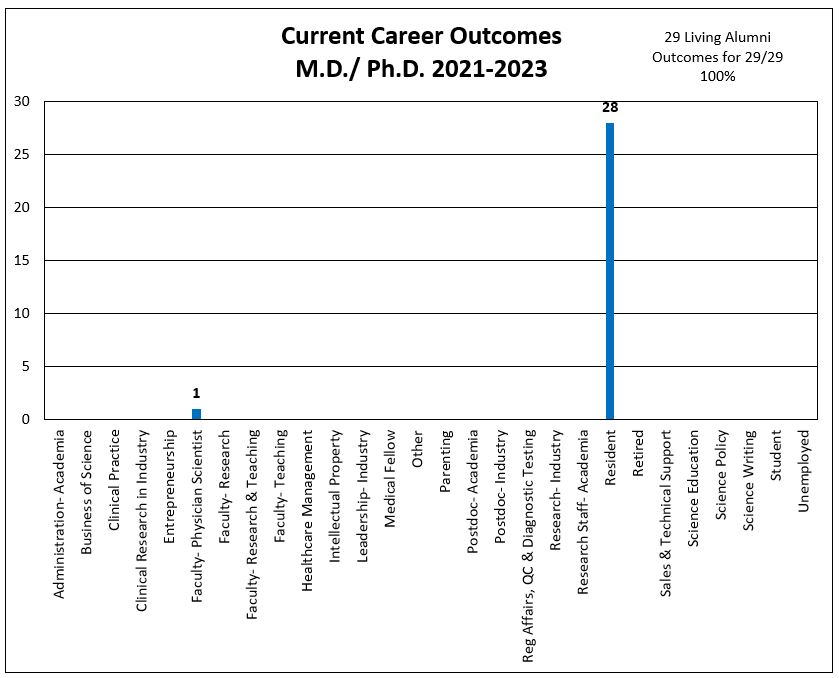
2021-2023
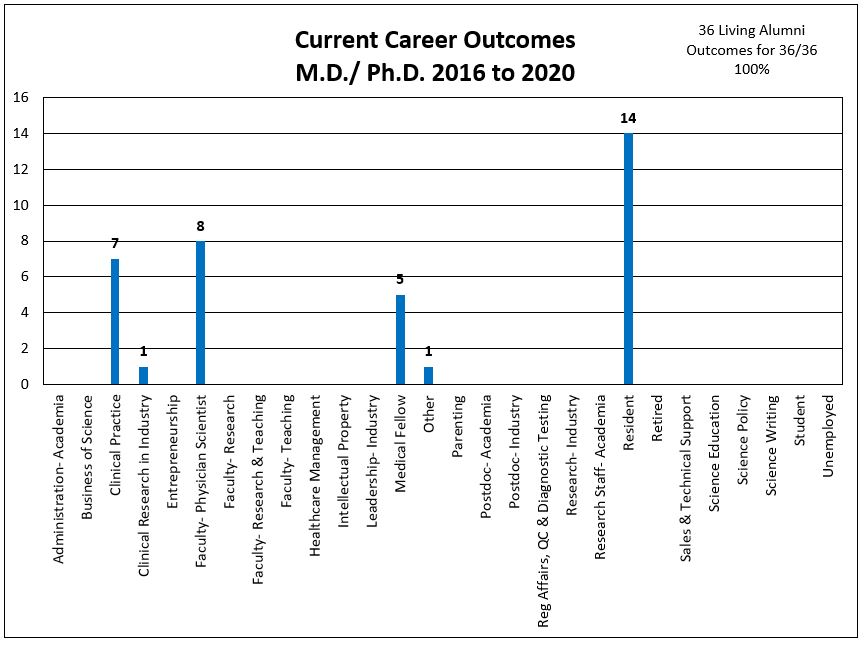
2016-2020
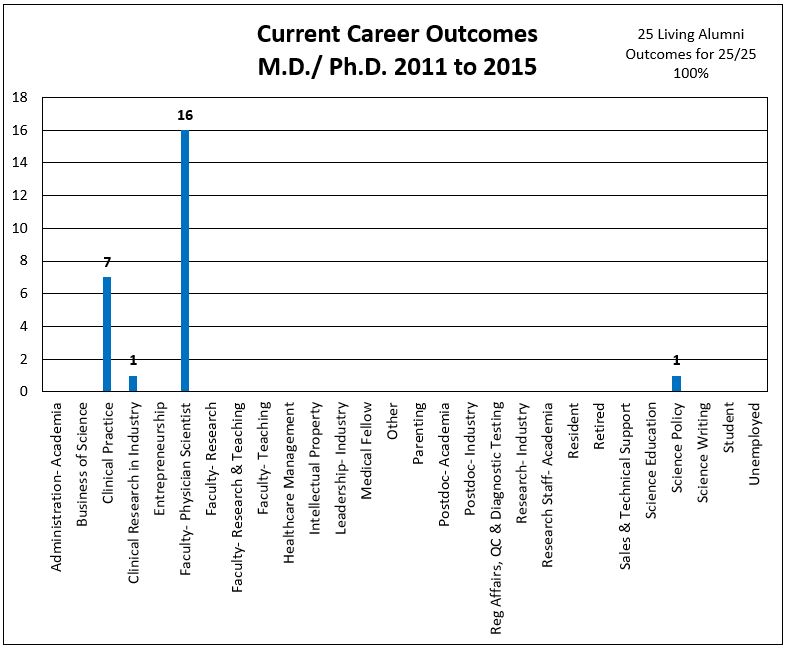
2011-2015
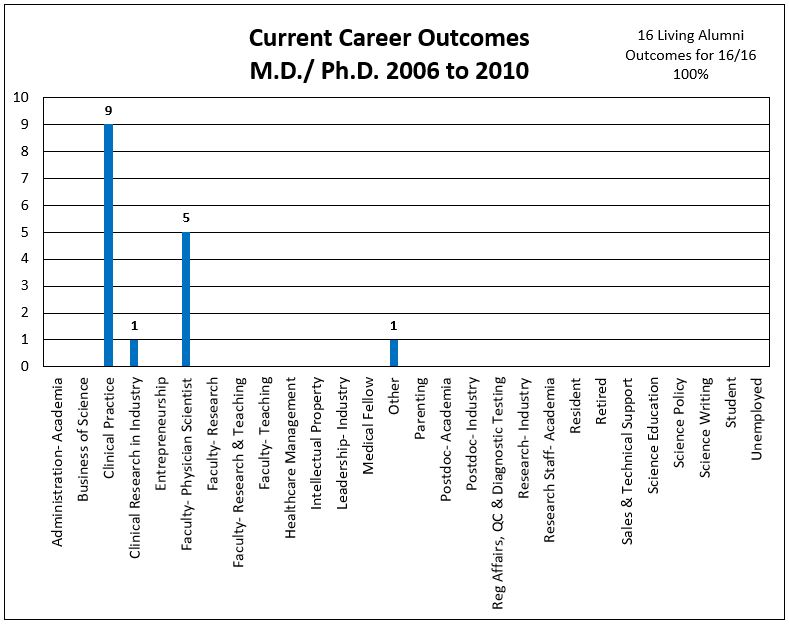
2006-2010
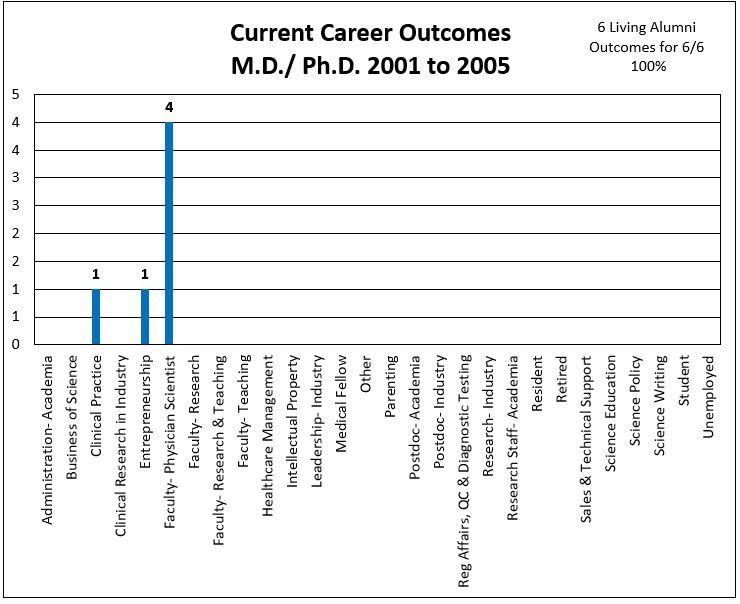
2001-2005
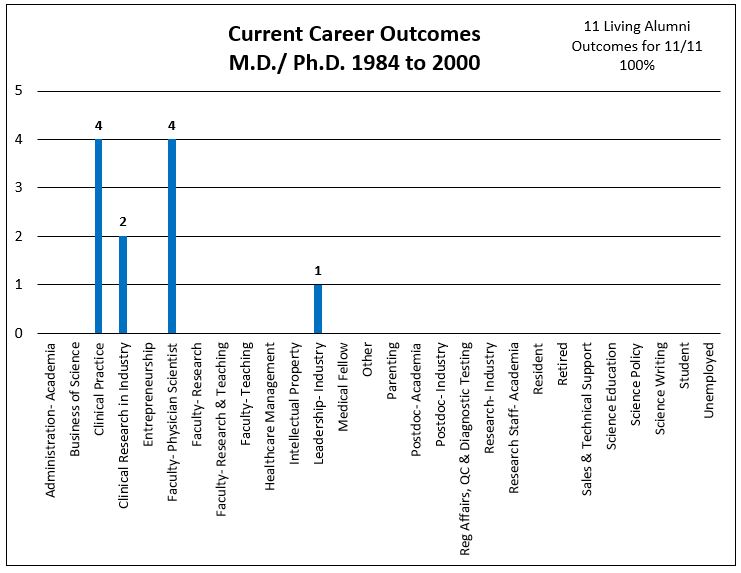
1984-2000


Last updated October 2023
Scroll down to see outcomes broken out into shorter ranges of years.